
Kimi K3
Moonshot AI
What is distinctive about Kimi K3 is its native visual architecture with KDA and AttnRes. Moonshot describes 2.8 trillion total parameters, 104 billion active parameters, 896 experts with 16 selected per step, and a 1,048,576-token context window. Text, images, and video belong to the same model.
Reasoning is always enabled and can be controlled with Low, High, and Max. Moonshot places K3 alongside Kimi K2.6. Local use and redistribution remain subject to the Kimi K3 license and the conditions of the released weights.
| Specification | Value and source |
|---|---|
| Weights | Open weightsSource |
| Access | API, LocalSource |
| Parameters | 2.8TSource |
| Active parameters | 104BSource |
| Context window | 1,048,576 tokensSource |
| Notes | 2.8T total, 104B active, 896 experts with 16 active experts per token, KDA hybrid linear attention, native vision, and a 1,048,576-token context window. Model weights are published.Source |
| License | Kimi K3 LicenseSource |
| Parameters | 2,800 BSource |
| Active parameters | 104 BSource |
| Architecture | MoE with KDA, gated MLA, 896 experts/16 selected, MoonViT V2Source |
| Output | TextSource |
| Tool calling | YesSource |
| Quantization | MXFP4 weights / MXFP8 activationsSource |
| Input | Text, Image, VideoSource |
| Reasoning mode | Always enabled; reasoning effort: low, high, max (default max).Source |
Benchmark meta-analysis
These Gradually indexes place selected published measurements on a 0 to 100 scale. They are not accuracy percentages and do not guarantee results in your application.
Retrieval dates of the sources used 2026-10-15 - 2026-10-19
Index 75.2 / 100
provisional
Published configurations differ within this comparison cohort. Treat the index as provisional.
Index 57.5 / 100
provisional
Published configurations differ within this comparison cohort. Treat the index as provisional.
Index 71.1 / 100
provisional
Published configurations differ within this comparison cohort. Treat the index as provisional.
Index 58.7 / 100
provisional
Published configurations differ within this comparison cohort. Treat the index as provisional.
Index 66.4 / 100
provisional
Published configurations differ within this comparison cohort. Treat the index as provisional.
Index 77.2 / 100
provisional
Published configurations differ within this comparison cohort. Treat the index as provisional.
Not enough coverage for a score yet
provisional
Published configurations differ within this comparison cohort. Treat the index as provisional.
Index 75.9 / 100
provisional
Published configurations differ within this comparison cohort. Treat the index as provisional.
Index 85.2 / 100
provisional
Published configurations differ within this comparison cohort. Treat the index as provisional.
Index 80.0 / 100
provisional
Published configurations differ within this comparison cohort. Treat the index as provisional.
Not enough coverage for a score yet
provisional
Published configurations differ within this comparison cohort. Treat the index as provisional.
Not enough coverage for a score yet
provisional
Published configurations differ within this comparison cohort. Treat the index as provisional.
Not enough coverage for a score yet
provisional
Published configurations differ within this comparison cohort. Treat the index as provisional.
Not enough coverage for a score yet
provisional
Published configurations differ within this comparison cohort. Treat the index as provisional.
Method version: benchmark-meta-score-v1
The index includes active measurements from reviewed primary sources when at least five models are compared in the same documented comparison slice across dataset, harness, agent, tools, and trial count. Each benchmark series and evaluator contributes one shared setup slice from the newest capture; when dates match, the wider slice is used. When one source and series include several explicitly documented reasoning tiers, the highest documented tier (none through max) is selected, never the best result value. The explicit source label “Non-reasoning” is treated as none. When selecting between multiple results, unknown or ambiguous tiers exclude the model from that series. Unambiguous single configurations do not require a tier ordering. The best individual result for each model is not selected. Equal raw values share the same rank percentile. Multiple series from the same evaluator within a family receive equal weight; evaluators within a family, families within an area, and areas in the overall index then receive equal weight. Unmeasured series remain visible in coverage and bounds. An overall score requires at least four areas, six test families, and two sources. An area score requires at least two test families. Every overall and area score also requires at least 50% of its panel weight.
Published model-specific parameters can differ. This is not a controlled experiment; comparisons with such differences are marked provisional.
Unmeasured portions are not entered as zero. They reduce coverage and contribute only to the displayed bounds. Scores with different coverage are therefore not equally complete.
The bounds hold observed percentiles fixed and allow missing contributions anywhere from 0 to 100. They are not confidence intervals or predictions of future recalculations.
The source count is not a count of independent experiments.
OECD handbook on composite indicatorsAll 46 test families and 12 of 51 raw measurements are listed here. The complete calculation for every model is available in the JSON export.
Nominal family weight in the overall panel: 1.43 % · Coverage of this test family: 100 %
Published configurations differ within this cohort.
Nominal family weight in the overall panel: 0.6 % · Coverage of this test family: 100 %
Published configurations differ within this cohort.
Nominal family weight in the overall panel: 0.6 % · Coverage of this test family: 100 %
Published configurations differ within this cohort.
Nominal family weight in the overall panel: 1.02 % · Coverage of this test family: 100 %
Published configurations differ within this cohort.
Nominal family weight in the overall panel: 0.6 % · Coverage of this test family: 100 %
Published configurations differ within this cohort.
Nominal family weight in the overall panel: 0.6 % · Coverage of this test family: 100 %
Published configurations differ within this cohort.
Nominal family weight in the overall panel: 0.48 % · Coverage of this test family: 100 %
Published configurations differ within this cohort.
Nominal family weight in the overall panel: 1.02 % · Coverage of this test family: 100 %
Published configurations differ within this cohort.
Nominal family weight in the overall panel: 0.6 % · Coverage of this test family: 100 %
Published configurations differ within this cohort.
Nominal family weight in the overall panel: 0.6 % · Coverage of this test family: 100 %
Published configurations differ within this cohort.
Nominal family weight in the overall panel: 2.38 % · Coverage of this test family: 100 %
Published configurations differ within this cohort.
Nominal family weight in the overall panel: 1.02 % · Coverage of this test family: 100 %
Published configurations differ within this cohort.
Nominal family weight in the overall panel: 2.38 % · Coverage of this test family: 100 %
Nominal family weight in the overall panel: 1.43 % · Coverage of this test family: 100 %
Nominal family weight in the overall panel: 1.02 % · Coverage of this test family: 100 %
Nominal family weight in the overall panel: 1.02 % · Coverage of this test family: 50 %
Nominal family weight in the overall panel: 0.48 % · Coverage of this test family: 100 %
Nominal family weight in the overall panel: 1.43 % · Coverage of this test family: 100 %
Nominal family weight in the overall panel: 1.79 % · Coverage of this test family: 100 %
Nominal family weight in the overall panel: 0.48 % · Coverage of this test family: 50 %
Nominal family weight in the overall panel: 0.48 % · Coverage of this test family: 83 %
Nominal family weight in the overall panel: 0.48 % · Coverage of this test family: 50 %
Nominal family weight in the overall panel: 1.43 % · Coverage of this test family: 100 %
Nominal family weight in the overall panel: 0.48 % · Coverage of this test family: 100 %
Nominal family weight in the overall panel: 1.02 % · Coverage of this test family: 100 %
Nominal family weight in the overall panel: 7.14 % · Coverage of this test family: 100 %
Nominal family weight in the overall panel: 1.02 % · Coverage of this test family: 100 %
Nominal family weight in the overall panel: 1.02 % · Coverage of this test family: 100 %
Nominal family weight in the overall panel: 0.48 % · Coverage of this test family: 100 %
Nominal family weight in the overall panel: 0.48 % · Coverage of this test family: 100 %
Nominal family weight in the overall panel: 1.79 % · Coverage of this test family: 100 %
Nominal family weight in the overall panel: 1.79 % · Coverage of this test family: 100 %
Nominal family weight in the overall panel: 1.79 % · Coverage of this test family: 100 %
Nominal family weight in the overall panel: 2.38 % · Coverage of this test family: 100 %
Nominal family weight in the overall panel: 2.38 % · Coverage of this test family: 100 %
Nominal family weight in the overall panel: 2.38 % · Coverage of this test family: 100 %
Nominal family weight in the overall panel: 1.02 % · Coverage of this test family: 100 %
Nominal family weight in the overall panel: 0.48 % · Coverage of this test family: 100 %
Nominal family weight in the overall panel: 1.43 % · Coverage of this test family: 100 %
Nominal family weight in the overall panel: 3.57 % · Coverage of this test family: 100 %
Nominal family weight in the overall panel: 3.57 % · Coverage of this test family: 100 %
Nominal family weight in the overall panel: 0.48 % · Coverage of this test family: 100 %
Nominal family weight in the overall panel: 1.02 % · Coverage of this test family: 100 %
Nominal family weight in the overall panel: 1.02 % · Coverage of this test family: 100 %
Nominal family weight in the overall panel: 0.48 % · Coverage of this test family: 100 %
Nominal family weight in the overall panel: 0.48 % · Coverage of this test family: 100 %
Each evaluator measures different capabilities under its own conditions. Test series, composite indices and their components stay separate. The detailed results below retain their scales, configurations and source dates.
| Evaluator | Test series | Composite indices | Recorded active measurements |
|---|---|---|---|
| Artificial Analysis | 13 | 1 | 28 |
| Vals AI | 31 | 2 | 228 |
| LMArena | 2 | 0 | 34 |
| Epoch AI | 6 | 0 | 12 |
Coverage is not a quality ranking. Overlapping tests and multiple settings do not count as independent experiments. Vendor claims, historical and disputed results are excluded from this overview and remain labelled in the detailed evidence.
Page 1 of 31
Accepted cases
1,029 German tasks test conversion from standard German into a defined simplified-language specification. It measures the Alman specification, not general German writing quality.
higher is betterAs of August 9, 2026Scale: 0% - 100%
Overall
Long-horizon software engineering tasks with executable project tests. The model, reasoning effort and agent jointly define a result. The vendor table reports different values.
Note (Kimi K3): The score evaluates the named model, reasoning effort, and agent configuration together, not an isolated model-only run.
Note: The score evaluates the named model, reasoning effort, and agent configuration together, not an isolated model-only run.
Note: The score evaluates the named model, reasoning effort, and agent configuration together, not an isolated model-only run.
Note: The score evaluates the named model, reasoning effort, and agent configuration together, not an isolated model-only run.
higher is betterAs of October 15, 2026Scale: 0% - 100%
SWE-bench
higher is betterAs of August 11, 2026Scale: 0% - 100%
SWE-bench
higher is betterAs of October 15, 2026Scale: 0% - 100%
These measurements have no matching peer values under the same test conditions. Their original values and sources remain available here.
Page 1 of 31
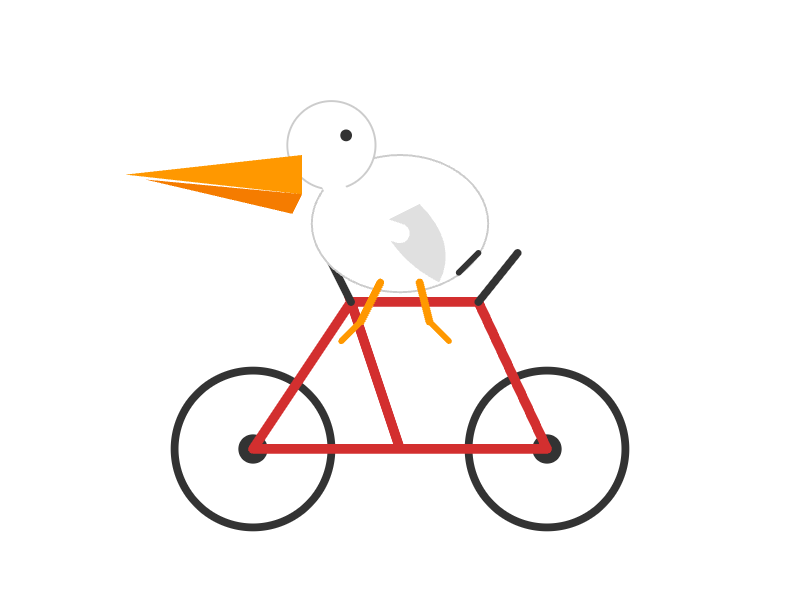
One SVG prompt and fixed output settings. Captures are shown only with 0 reported reasoning tokens or documented lack of reasoning controls. Identical test conditions do not make the models' internal compute identical.
A community classic for free-form SVG drawing.
Kimi K3

Reasoning (requested): high
Visually reviewed. This individual test does not establish overall model quality.
Generate an SVG of a pelican riding a bicycle
Token limit including reasoning: 8,192 tokens
Task origin (Simon Willison)68.5 / 100