
Claude Opus 5
Unavailable in this round
Anthropic
At launch, Claude Opus 5 was the default model for Claude Max and the strongest model in Claude Pro. It followed Claude Opus 4.8 and, according to Anthropic, brought much of Claude Fable 5’s capability into a generally available Opus model.
The provider reported more than twice Opus 4.8’s Frontier-Bench v0.1 result and a 0.5% gap to Fable 5 on CursorBench 3.2 at maximum effort. These are vendor comparisons. For controlled cybersecurity work, Claude Mythos 5 remained the more specialized option.
The LLM comparison hub's selected-panel index averages rank percentiles from 10 documented comparison cohorts. Benchmark meta-scores are shown in the benchmark section.
Benchmark meta-analysis
These Gradually indexes place selected published measurements on a 0 to 100 scale. They are not accuracy percentages and do not guarantee results in your application.
Retrieval dates of the sources used 2026-10-15 - 2026-10-19
Index 81.7 / 100
provisional
Published configurations differ within this comparison cohort. Treat the index as provisional.
Index 89.2 / 100
provisional
Published configurations differ within this comparison cohort. Treat the index as provisional.
Index 70.2 / 100
provisional
Published configurations differ within this comparison cohort. Treat the index as provisional.
Index 77.1 / 100
provisional
Published configurations differ within this comparison cohort. Treat the index as provisional.
Index 97.5 / 100
provisional
Published configurations differ within this comparison cohort. Treat the index as provisional.
Not enough coverage for a score yet
provisional
Published configurations differ within this comparison cohort. Treat the index as provisional.
Index 78.3 / 100
provisional
Published configurations differ within this comparison cohort. Treat the index as provisional.
Index 93.6 / 100
provisional
Published configurations differ within this comparison cohort. Treat the index as provisional.
Index 87.3 / 100
provisional
Published configurations differ within this comparison cohort. Treat the index as provisional.
Index 97.8 / 100
provisional
Published configurations differ within this comparison cohort. Treat the index as provisional.
Not enough coverage for a score yet
provisional
Published configurations differ within this comparison cohort. Treat the index as provisional.
Index 87.7 / 100
provisional
Published configurations differ within this comparison cohort. Treat the index as provisional.
Not enough coverage for a score yet
provisional
Published configurations differ within this comparison cohort. Treat the index as provisional.
Not enough coverage for a score yet
provisional
Published configurations differ within this comparison cohort. Treat the index as provisional.
Not enough coverage for a score yet
provisional
Published configurations differ within this comparison cohort. Treat the index as provisional.
Method version: benchmark-meta-score-v1
The index includes active measurements from reviewed primary sources when at least five models are compared in the same documented comparison slice across dataset, harness, agent, tools, and trial count. Each benchmark series and evaluator contributes one shared setup slice from the newest capture; when dates match, the wider slice is used. When one source and series include several explicitly documented reasoning tiers, the highest documented tier (none through max) is selected, never the best result value. The explicit source label “Non-reasoning” is treated as none. When selecting between multiple results, unknown or ambiguous tiers exclude the model from that series. Unambiguous single configurations do not require a tier ordering. The best individual result for each model is not selected. Equal raw values share the same rank percentile. Multiple series from the same evaluator within a family receive equal weight; evaluators within a family, families within an area, and areas in the overall index then receive equal weight. Unmeasured series remain visible in coverage and bounds. An overall score requires at least four areas, six test families, and two sources. An area score requires at least two test families. Every overall and area score also requires at least 50% of its panel weight.
Published model-specific parameters can differ. This is not a controlled experiment; comparisons with such differences are marked provisional.
Unmeasured portions are not entered as zero. They reduce coverage and contribute only to the displayed bounds. Scores with different coverage are therefore not equally complete.
The bounds hold observed percentiles fixed and allow missing contributions anywhere from 0 to 100. They are not confidence intervals or predictions of future recalculations.
The source count is not a count of independent experiments.
OECD handbook on composite indicatorsAll 46 test families and 12 of 52 raw measurements are listed here. The complete calculation for every model is available in the JSON export.
Nominal family weight in the overall panel: 1.43 % · Coverage of this test family: 100 %
Published configurations differ within this cohort.
Nominal family weight in the overall panel: 0.6 % · Coverage of this test family: 100 %
Published configurations differ within this cohort.
Nominal family weight in the overall panel: 0.6 % · Coverage of this test family: 100 %
Published configurations differ within this cohort.
Nominal family weight in the overall panel: 1.02 % · Coverage of this test family: 100 %
Published configurations differ within this cohort.
Nominal family weight in the overall panel: 0.6 % · Coverage of this test family: 100 %
Published configurations differ within this cohort.
Nominal family weight in the overall panel: 1.02 % · Coverage of this test family: 100 %
Published configurations differ within this cohort.
Nominal family weight in the overall panel: 0.6 % · Coverage of this test family: 100 %
Published configurations differ within this cohort.
Nominal family weight in the overall panel: 2.38 % · Coverage of this test family: 100 %
Published configurations differ within this cohort.
Nominal family weight in the overall panel: 1.02 % · Coverage of this test family: 100 %
Published configurations differ within this cohort.
Nominal family weight in the overall panel: 1.43 % · Coverage of this test family: 100 %
Published configurations differ within this cohort.
Published configurations differ within this cohort.
Nominal family weight in the overall panel: 1.02 % · Coverage of this test family: 100 %
Published configurations differ within this cohort.
Nominal family weight in the overall panel: 1.02 % · Coverage of this test family: 50 %
Nominal family weight in the overall panel: 0.48 % · Coverage of this test family: 100 %
Nominal family weight in the overall panel: 7.14 % · Coverage of this test family: 100 %
Nominal family weight in the overall panel: 1.43 % · Coverage of this test family: 100 %
Nominal family weight in the overall panel: 1.79 % · Coverage of this test family: 100 %
Nominal family weight in the overall panel: 1.79 % · Coverage of this test family: 100 %
Nominal family weight in the overall panel: 0.48 % · Coverage of this test family: 50 %
Nominal family weight in the overall panel: 0.48 % · Coverage of this test family: 83 %
Nominal family weight in the overall panel: 0.48 % · Coverage of this test family: 100 %
Nominal family weight in the overall panel: 1.43 % · Coverage of this test family: 100 %
Nominal family weight in the overall panel: 0.48 % · Coverage of this test family: 100 %
Nominal family weight in the overall panel: 1.02 % · Coverage of this test family: 100 %
Nominal family weight in the overall panel: 7.14 % · Coverage of this test family: 100 %
Nominal family weight in the overall panel: 1.02 % · Coverage of this test family: 100 %
Nominal family weight in the overall panel: 1.02 % · Coverage of this test family: 100 %
Nominal family weight in the overall panel: 0.48 % · Coverage of this test family: 100 %
Nominal family weight in the overall panel: 0.48 % · Coverage of this test family: 100 %
Nominal family weight in the overall panel: 1.79 % · Coverage of this test family: 100 %
Nominal family weight in the overall panel: 1.79 % · Coverage of this test family: 100 %
Nominal family weight in the overall panel: 1.79 % · Coverage of this test family: 100 %
Nominal family weight in the overall panel: 2.38 % · Coverage of this test family: 100 %
Nominal family weight in the overall panel: 2.38 % · Coverage of this test family: 100 %
Nominal family weight in the overall panel: 2.38 % · Coverage of this test family: 100 %
Nominal family weight in the overall panel: 1.02 % · Coverage of this test family: 100 %
Nominal family weight in the overall panel: 1.43 % · Coverage of this test family: 100 %
Nominal family weight in the overall panel: 0.48 % · Coverage of this test family: 100 %
Nominal family weight in the overall panel: 1.43 % · Coverage of this test family: 100 %
Nominal family weight in the overall panel: 3.57 % · Coverage of this test family: 100 %
Nominal family weight in the overall panel: 0.6 % · Coverage of this test family: 100 %
Nominal family weight in the overall panel: 3.57 % · Coverage of this test family: 100 %
Nominal family weight in the overall panel: 1.43 % · Coverage of this test family: 100 %
Nominal family weight in the overall panel: 1.02 % · Coverage of this test family: 100 %
Nominal family weight in the overall panel: 1.02 % · Coverage of this test family: 100 %
Nominal family weight in the overall panel: 0.48 % · Coverage of this test family: 100 %
Nominal family weight in the overall panel: 0.48 % · Coverage of this test family: 100 %
Each evaluator measures different capabilities under its own conditions. Test series, composite indices and their components stay separate. The detailed results below retain their scales, configurations and source dates.
| Evaluator | Test series | Composite indices | Recorded active measurements |
|---|---|---|---|
| Artificial Analysis | 11 | 1 | 62 |
| Vals AI | 34 | 2 | 230 |
| LMArena | 4 | 0 | 76 |
| Epoch AI | 6 | 0 | 11 |
| ARC Prize | 1 | 0 | 1 |
Coverage is not a quality ranking. Overlapping tests and multiple settings do not count as independent experiments. Vendor claims, historical and disputed results are excluded from this overview and remain labelled in the detailed evidence.
Page 1 of 35
Accepted cases
1,029 German tasks test conversion from standard German into a defined simplified-language specification. It measures the Alman specification, not general German writing quality.
higher is betterAs of August 9, 2026Scale: 0% - 100%
| Sub-task | Claude Opus 5 (This model) | Claude Opus 5.5 | Claude Sonnet 5.5 |
|---|---|---|---|
| Hard | 43.14% | 47.06% (best value in this row) | 45.1% |
| Human-solvable | 87.67% | 86.76% | 89.5% (best value in this row) |
| Overall | 79.26% | 79.26% | 81.11% (best value in this row) |
higher is betterAs of October 15, 2026Source: Vals AIbars scaled within each row, not across rows
Kaggle score
1,000 verified short-answer prompts test factual knowledge without search or other tools. It does not measure document grounding, web research, or a RAG system.
higher is betterAs of August 9, 2026Scale: 0% - 100%
Overall
502 technical decision points from engineering and research workflows. Each choice is presented in both answer orders. The overall score averages engineering and research and requires both answer orders to be correct. Unparseable responses count as wrong. Reasoning settings and output budget are part of the setup.
Note (Claude Opus 5): 0 of 1,004 responses were unparseable and counted as wrong. Not a Gradually test.
Note: 0 of 1,004 responses were unparseable and counted as wrong. Not a Gradually test.
Note: 0 of 1,004 responses were unparseable and counted as wrong. Not a Gradually test.
Note: 10 of 1,004 responses were unparseable and counted as wrong. Not a Gradually test.
Note: 0 of 1,004 responses were unparseable and counted as wrong. Not a Gradually test.
Note: 17 of 1,004 responses were unparseable and counted as wrong. Not a Gradually test.
Note: 0 of 1,004 responses were unparseable and counted as wrong. Not a Gradually test.
Note: 0 of 1,004 responses were unparseable and counted as wrong. Not a Gradually test.
Note: 3 of 1,004 responses were unparseable and counted as wrong. Not a Gradually test.
Note: 2 of 1,004 responses were unparseable and counted as wrong. Not a Gradually test.
Note: 112 of 1,004 responses were unparseable and counted as wrong. Not a Gradually test.
Note: 24 of 1,004 responses were unparseable and counted as wrong. Not a Gradually test.
Note: 93 of 1,004 responses were unparseable and counted as wrong. Not a Gradually test.
Note: 459 of 1,004 responses were unparseable and counted as wrong. Not a Gradually test.
higher is betterAs of September 26, 2026Scale: 0% - 100%
Agentic evaluation of tasks in reproducible terminal environments. The agent, tools, environment, and reasoning level are part of the result. Scores from older Terminal-Bench versions are not directly comparable.
| Sub-task | Claude Opus 5 (This model) | Claude Fable 5.1 |
|---|---|---|
| Overall | 50.3% | 54.55% (best value in this row) |
| Overall | 53.94% | 57.88% (best value in this row) |
higher is betterAs of October 15, 2026Source: Terminal-Benchbars scaled within each row, not across rows
Note (Overall): Selection of exactly identified models from the official 35-row leaderboard. Agents and reasoning efforts differ. These values do not belong to the separate Vals Mini-SWE-agent cohort.
Note (Overall): Selection of exactly identified models from the official 35-row leaderboard. Agents and reasoning efforts differ. These values do not belong to the separate Vals Mini-SWE-agent cohort.
Overall
Agentic evaluation of tasks in reproducible terminal environments. The agent, tools, environment, and reasoning level are part of the result. Scores from older Terminal-Bench versions are not directly comparable.
Note (Claude Opus 5): Selection of exactly identified models from the official 35-row leaderboard. Agents and reasoning efforts differ. These values do not belong to the separate Vals Mini-SWE-agent cohort.
Note: Selection of exactly identified models from the official 35-row leaderboard. Agents and reasoning efforts differ. These values do not belong to the separate Vals Mini-SWE-agent cohort.
Note: Selection of exactly identified models from the official 35-row leaderboard. Agents and reasoning efforts differ. These values do not belong to the separate Vals Mini-SWE-agent cohort.
Note: Selection of exactly identified models from the official 35-row leaderboard. Agents and reasoning efforts differ. These values do not belong to the separate Vals Mini-SWE-agent cohort.
Note: Selection of exactly identified models from the official 35-row leaderboard. Agents and reasoning efforts differ. These values do not belong to the separate Vals Mini-SWE-agent cohort.
Note: Selection of exactly identified models from the official 35-row leaderboard. Agents and reasoning efforts differ. These values do not belong to the separate Vals Mini-SWE-agent cohort.
Note: Selection of exactly identified models from the official 35-row leaderboard. Agents and reasoning efforts differ. These values do not belong to the separate Vals Mini-SWE-agent cohort.
higher is betterAs of October 15, 2026Scale: 0% - 100%
| Sub-task | Claude Opus 5 (This model) | Claude Sonnet 5.5 | Claude Opus 5.5 | Claude Fable 5 | Claude Fable 5.1 | Claude Opus 4.8 | Claude Sonnet 5 | Claude Opus 4.7 |
|---|---|---|---|---|---|---|---|---|
| CLI | 53.3% | 69.77% (best value in this row) | 65.53% | 60.09% | 52.81% | 40.14% | 36.33% | 35.17% |
| COBOL | 70% (best value in this row) | 70% (best value in this row) | 70% (best value in this row) | 40% | 60% | 68.57% | 68.57% | 70% (best value in this row) |
| Overall | 57.47% | 69.83% (best value in this row) | 66.65% | 55.07% | 54.61% | 47.25% | 44.39% | 43.88% |
higher is betterAs of October 15, 2026Source: Vals AIbars scaled within each row, not across rows
Page 1 of 35
One SVG prompt and fixed output settings. Captures are shown only with 0 reported reasoning tokens or documented lack of reasoning controls. Identical test conditions do not make the models' internal compute identical.
Unavailable in this round
A community classic for free-form SVG drawing.
Claude Opus 5
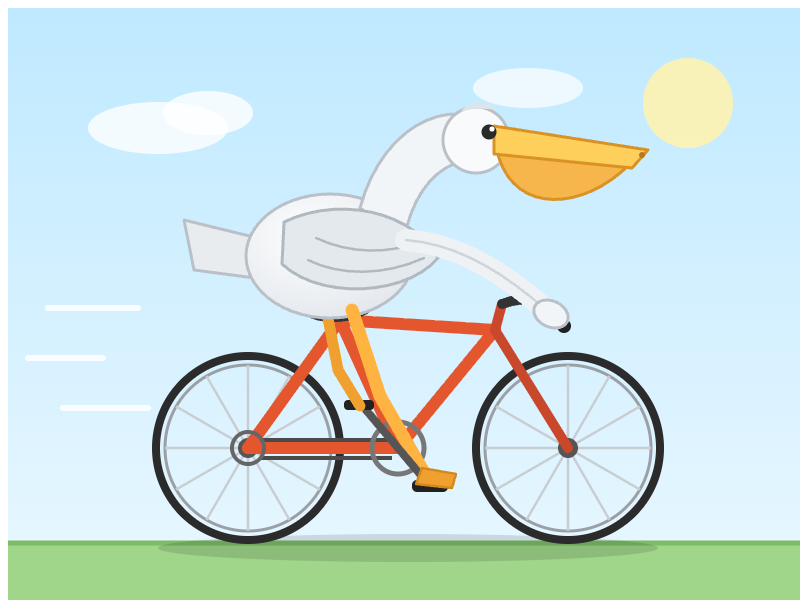
Reasoning (requested): high
Visually reviewed. This individual test does not establish overall model quality.
Generate an SVG of a pelican riding a bicycle
Token limit including reasoning: 8,192 tokens
Task origin (Simon Willison)62.8 / 100
| Specification | Value and source |
|---|---|
| Weights | ProprietarySource |
| Access | APISource |
| Context window | 1,000,000 tokensSource |
| Knowledge cutoff | May 2026Source |
| Notes | Released July 24, 2026. Near-frontier intelligence at launch, close to Fable 5 at half the price ($5/$25). 1M context, 128K output, and a May 2026 knowledge cutoff. It became the new default on Claude Max and strongest model on Claude Pro at launch. It led Frontier-Bench v0.1, surpassed Fable 5 on OSWorld 2.0, came within 0.5% of Fable 5 on CursorBench 3.2, and trailed Mythos 5 on cybersecurity. Those results describe the pre-Fable-5.1 and pre-Mythos-5.1 cohort.Source |
| API model ID | claude-opus-5Source |
| Source status | activeSource |
| Release | 2026-07-24Source |
| Maximum output | 128,000 tokensSource |
| Input | Text, imagesSource |
| Output | TextSource |
| Reasoning mode | adaptive; default highSource |
| Knowledge cutoff | 2026-05Source |
| Tool calling | YesSource |
| Structured output | YesSource |